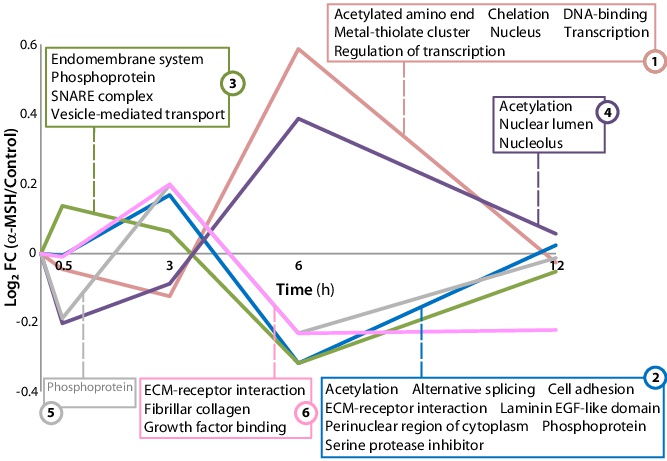
Fig. 8. Time-course gene cluster profiles. The 6 different expression profiles represent time-dependent dynamic gene modulation as the mean of significant temporal profiles grouped on the basis of their similarity. Each cluster profile is associated with gene sets and pathways (coloured rectangles) significant at the enrichment analysis. For cluster 5, a gene set with a nominal p<0.05 is indicated. On the y-axes is the log2 mean fold change (FC) relative to control cells, i.e. the log2 gene expression ratio of α-MSH stimulated cells to non-stimulated cells; on the x-axis is the experimental time scale (hours).